Payer transparency
Payer price transparency data and negotiated rate benchmarking
Visibility into rates. Intelligence you can act on.
Machine-readable payer files. Negotiated rates transformed into market intelligence — so you can benchmark, prioritize, and negotiate with confidence.

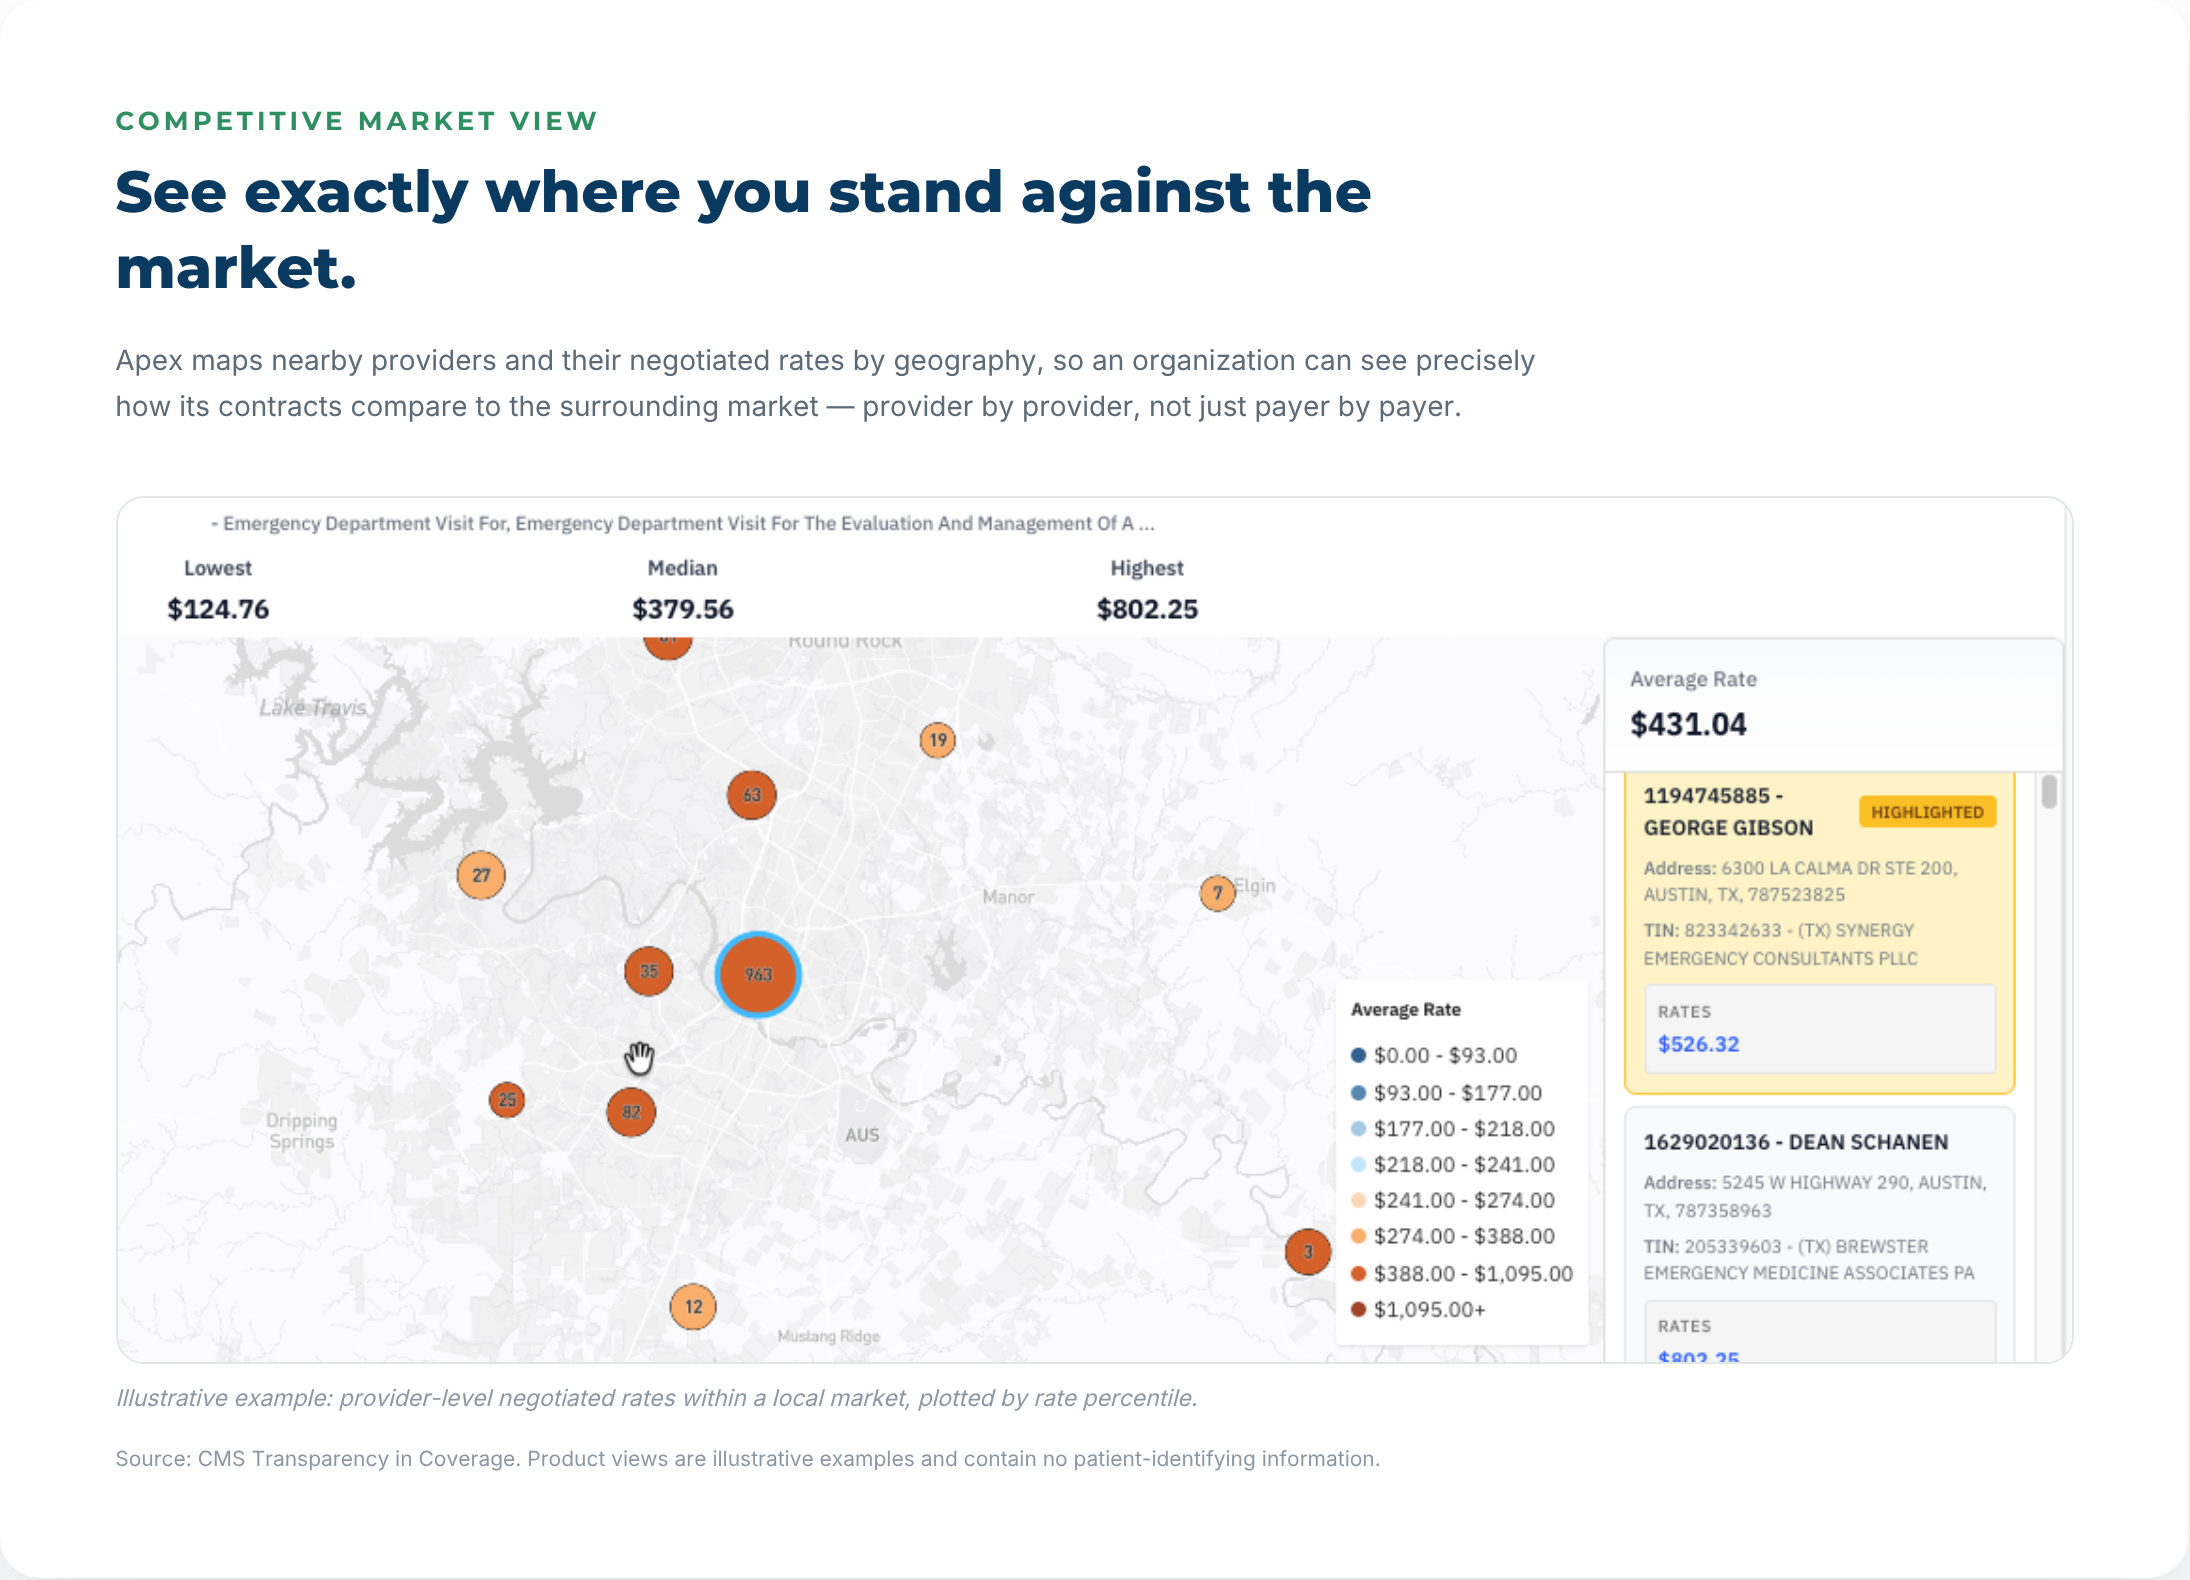
Competitive market view
See exactly where you stand against the market
Apex maps nearby providers and their negotiated rates by geography, so an organization can see precisely how its contracts compare to the surrounding market — provider by provider, not just payer by payer.
Lowest rate
$124.76
Median rate
$379.56
Highest rate
$802.25
Illustrative example: provider-level negotiated rates for an emergency department evaluation and management visit within a local market, plotted by rate percentile. Source: CMS Transparency in Coverage. Product views are illustrative examples and contain no patient-identifying information.
What price transparency unlocks
The external market is now observable
Most health plans and issuers publish machine-readable files containing in-network negotiated rates. PayerPrice continuously discovers, validates, and normalizes those files into comparable reimbursement evidence by payer, network, provider, code, geography, setting, and modifier. Apex joins that public data to each organization’s own contracts, claims, utilization, and costs — turning it into a strategy, not just a report.
Source: CMS Transparency in Coverage. Product views are illustrative examples and contain no patient-identifying information.
Market data sets the benchmark. Your data tells the story.
Apex layers your own payer mix, service lines, and drug economics on top of market rates. All values below are illustrative.
Revenue by payer
Anonymized regional payer mix
55% of allowed amount sits in the top 2 payers; 31% exposure to the largest relationship.
Revenue by service line
Anonymized illustrative mix
High-value services and codes
99214 · 99215 · 20610 · 96372 · 93000 · specialty-specific drug codes
Why payer mix matters
When a few payers drive most of your revenue, a small rate change with one of them moves the whole practice. Knowing your concentration tells you which contract to negotiate first.
Pairing that with the codes you bill most shows where a rate gap costs the most.
Managed care intelligence
Not every payer relationship is equally profitable
The highest-paying payer is not always the most profitable. Margin must be monitored by service, payer, date, cost, and reimbursement method — especially in drug and infusion economics, where acquisition cost moves independently of the fee schedule.
Specialty example
Drug reimbursement and margin
| Therapy | Payer A | Payer B | Payer C | Wtd. |
|---|---|---|---|---|
| Therapy AImmunotherapy | +14.8% | +11.2% | +5.4% | +11.9% |
| Therapy BBiologic | +9.7% | +4.6% | −1.8% | +5.1% |
| Therapy CChemotherapy | +3.1% | −2.6% | −5.9% | −1.7% |
| Therapy DSupportive drug | +12.1% | +8.5% | +2.8% | +8.4% |
Wtd. = revenue-weighted margin across Payer A, Payer B, and Payer C.
A payer offering a lower headline rate can still deliver stronger margin once drug acquisition cost, wastage, and site-of-service differentials are factored in — which is why margin, not rate, drives negotiation priority.
What is Transparency in Coverage?
The federal Transparency in Coverage rule requires most group health plans and health insurance issuers to publish machine-readable files of their in-network negotiated rates and out-of-network allowed amounts. Plans began posting these files in July 2022 and update them monthly.
Separately, the Hospital Price Transparency rule has required hospitals to publish their standard charges since January 2021.
For the first time, providers can see what payers pay competitors for the same service in the same market. The challenge is scale: the files are enormous, inconsistent, and hard to compare. PayerPrice solves that by normalizing the data so Apex can turn it into a negotiation position.
How providers use payer transparency data
Prepare for contract renewals
Walk into negotiations with local rate benchmarks for your highest-volume codes.
Find below-market rates
Spot codes and payers where you are paid under the market median.
Prioritize payers
Rank negotiations by revenue at stake, not by which contract renews next.
Evaluate new markets
Check local reimbursement before expanding into a new geography or service line.
Support due diligence
Compare a target’s contracts to the market before an acquisition or partnership.
Monitor over time
Track how payer rates move each month as new files are published.
Price transparency FAQ
What is a payer machine-readable file?
A machine-readable file (MRF) is a large data file that health plans publish under the Transparency in Coverage rule. It lists negotiated rates for covered items and services by provider, billing code, and network.
Can I see what payers pay my competitors?
Yes. Because negotiated rates are published by provider, Apex can show how your rates compare to nearby providers for the same code and payer.
Is patient data involved?
No. Transparency in Coverage files contain rates, not patient information. Apex product views are illustrative and contain no patient-identifying information.
What is PayerPrice?
PayerPrice is the data platform that powers Apex’s transparency analysis. It continuously discovers, validates, and normalizes payer files into comparable reimbursement evidence.
See how your rates compare to your market
We’ll benchmark your top codes against local negotiated rates on a free discovery call.